
Vision maps, journey maps, and infographics
Whether you’re telling the story of a recent transformation, or you need a chart depicting a complex strategy in digestible bite-size chunks, we will work with you to visually represent what you want to communicate. StoryMaps (also called Journey Maps or Vision Maps) and Infographics are created in the studio and can be digitally illustrated, or drawn on paper and shipped to you. After an initial input call, we will send sketches for your approval and make sure that all of your key points are included in the visual. The resulting image will be one that is long-lasting for you to speak to and share.
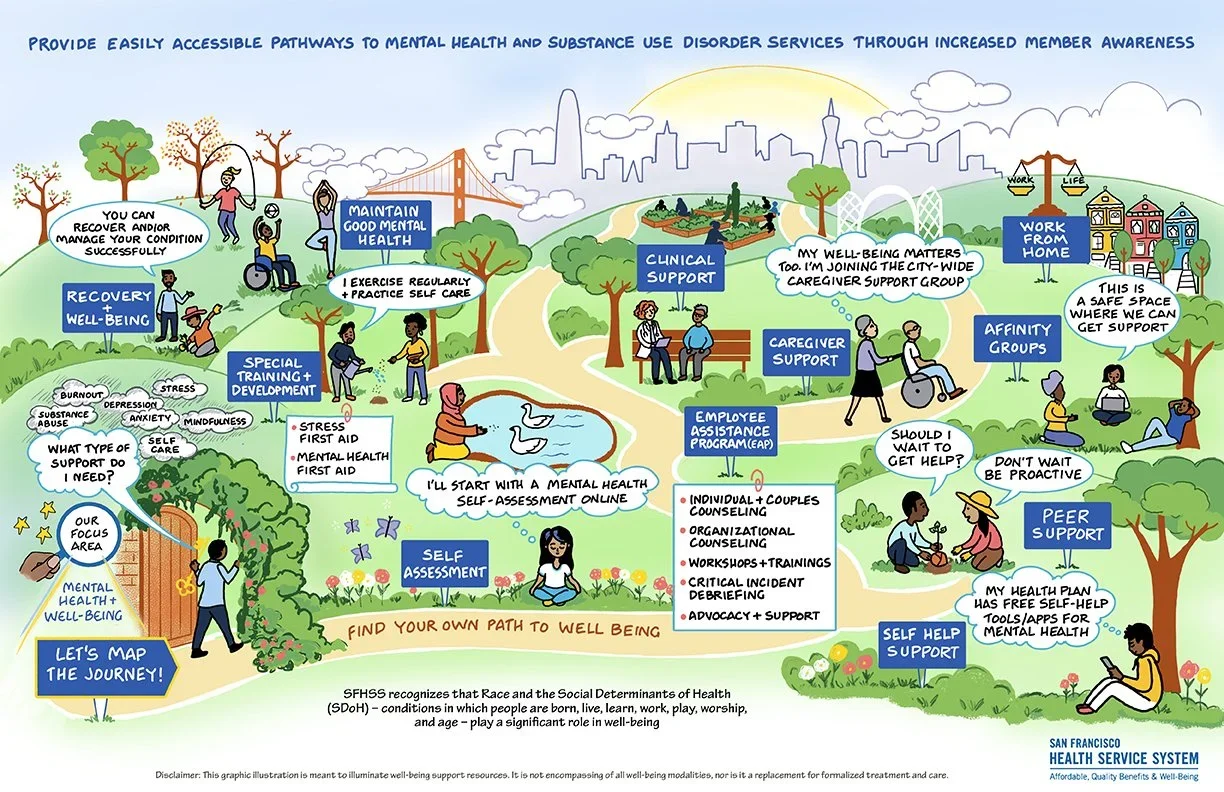
CASE STUDY:
City of San Francisco Mental Health Journey Map
When the City of San Francisco approached me about their employee mental health benefits program, they faced a common challenge: they offered comprehensive services, but many employees weren't aware of or accessing them. Information was scattered across multiple platforms, creating unnecessary barriers for those who needed support most.
Working closely with their wellness team, we developed an intuitive visual solution: a garden journey map. This metaphor resonated because gardens naturally convey growth, healing, and ongoing care – perfect for representing mental health resources. Different garden elements represented various services, and most importantly, how to access appropriate support.
After interviewing stakeholders and mapping existing services, I developed the visual concept through several collaborative iterations. We tested the design with diverse employee groups to ensure it was both comprehensive and approachable for everyone.
By creating an emotional connection while providing clear guidance, the journey map makes mental health support more approachable for city employees.